所屬科目:研究所、轉學考(插大)◆生地化循環與氣候
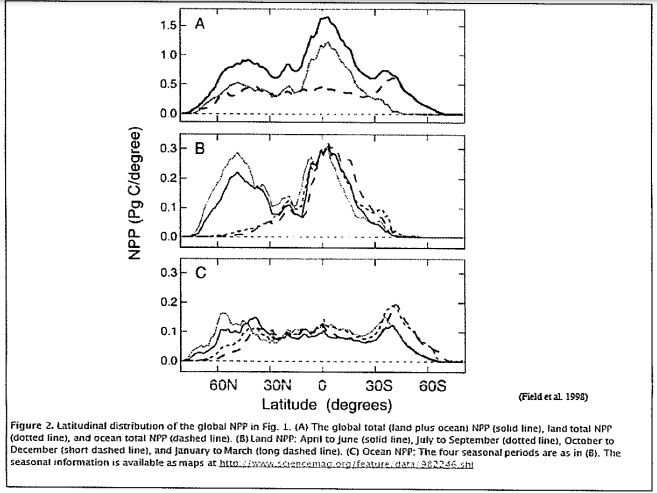
(3) View the latitudinal distribution of the global NPP below. A is global average, B is land average, and C is ocean average. Different lines indicate different seasons as explained in the figure captions. Please describe the latitudinal distribution patterns for NPP for land (5 pt) and ocean (5 pt) respectively. You may have noticed that for both land and ocean NPP. there is a local minimum around 20-30 degree N/S. Do they have similar or different reasons? Please explain. (10 pt)
(4) Now compare the latitudinal patterns of carbon storage on land in the following figure. The areas above 0 on the y axis is carbon storage above ground, and the areas below 0 on the y axis is carbon storage below ground (or soil organic carbon SOC for diflerent depths shown in the figure caption). Summarize the similarity and differences between the two (5 pt), explain what proce cesses drive the similarities and differences (5 pt). How would we predict future changes in carbon storage under the direct influence of CO2 rise and global warming (5 pt)?The latitudinal patterns of terrestrial carbon stocks, both aboveground living plant biomass (green) [data from Gibbs et al. (114)] and soil carbon stocks (brown) [data from Hengl et al. (18)].
(a) (6 pts) Above the ground and near the surface layer, aerobic(有 氧) respiration is a major process. Please write the overall reaction for aerobic respiration and calculate AE°(w) (using CH2Oas the reactant).
(c) (12 pts) Given your listed rcactions above (in a&b), please estimate their Gibbs free energy yield per clectron (in the unit of kcal per electron), using △G0 = - zF△E°(w) (z is the number of electrons, F is Faraday's constant 23.06 1 kcal/volt). Compare their Gibbs free energy, and explain how this would control the oxidation/reduction sequence in the sediments with the observed profile shown in Figure A.
 阿摩線上測驗
登入
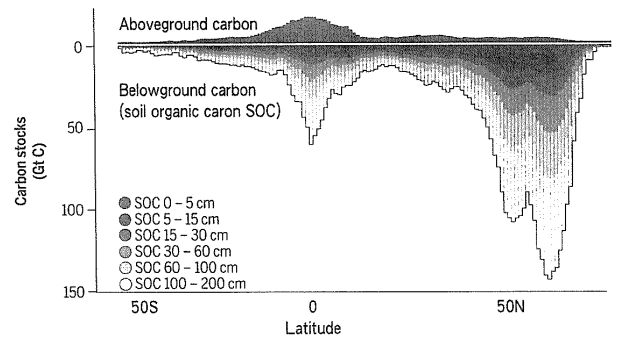 The latitudinal patterns of terrestrial carbon stocks, both aboveground living plant biomass (green) [data from Gibbs et al. (114)] and soil carbon stocks (brown) [data from Hengl et al. (18)].
 g C/yr, and the average C/N ratio of plant biomass is 100, what is the upper limit (i.e., maximum estimate) of oxygen used every year in microbial nitrification?