 阿摩線上測驗
1. Compare the two reaction coordinate diagrams below and select the answer that correctly describes their relationship. In eachcase, the single intermediate is the ES complex.Free energy,
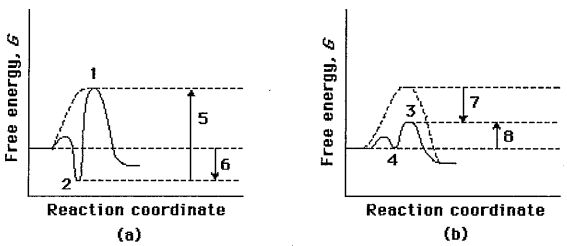
(A) Diagram (a) describes a strict "lock and key" model, whereas diagram (b) describes a transition-state complementarity model.
(B) The activation energy for the catalyzed reaction is #5 in diagram (a) and is #7 in diagram (b).
(C) The activation energy for the uncatalyzed reaction is given by #5 + #6 in diagram (a) and by #7 + #4 in diagram (b).
(D) The contribution of binding energy is given by #5 in diagram (a) and by #7 in diagram (b).
(E) The ES complex is given by #2 in diagram (a) and #3 in diagram (b).
答案:登入後查看
統計: 尚無統計資料
統計: 尚無統計資料