Figure 1 【題組】2. The movement from point..-阿摩線上測驗
載入中..請稍候..
Figure 1

 | 隨手按讚五星 祝上榜 (2024/05/19): (C)An increase in the quantity supplied
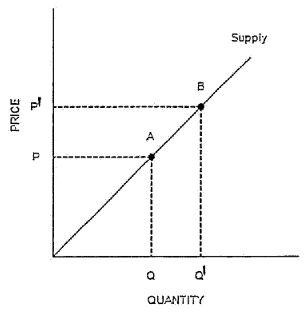
The graph shows a supply curve which illustrates the relationship between the price of a good and the quantity of the good that producers are willing to supply.
A movement from point A to point B on this graph indicates a movement along the supply curve, which is caused by a change in the price of the good.
| 檢舉 |
|
|
|