題組內容
5. pE-pH diagram is a useful tool to predict chemical state of species in water. The following figure is a typical pE-pH diagram for iron in water at the total soluble iron concentration of 1 x M.
M.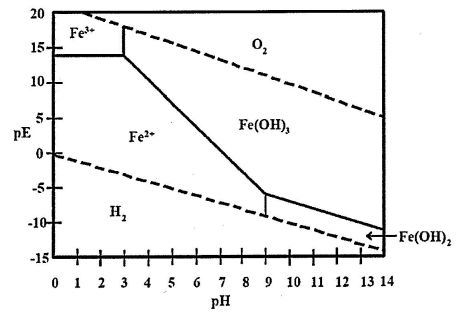
 阿摩線上測驗
登入
阿摩線上測驗
登入
5. pE-pH diagram is a useful tool to predict chemical state of species in water. The following figure is a typical pE-pH diagram for iron in water at the total soluble iron concentration of 1 x M.