 阿摩線上測驗
題組內容
四、 (30%)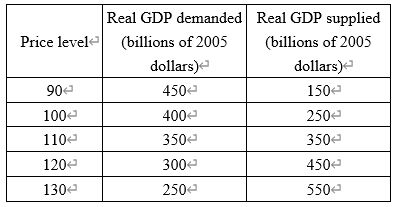
The table above shows Yellowland's economy aggregate demand and supply schedules. Yellowland's potential GDP is $300 billion.
1. Plot the aggregate demand curve, the short-run aggregate supply curve, and the long-run aggregate supply curve.(5%)