 阿摩線上測驗
題組內容
十三、依據下文回答問題:
This means of determining activation energy was first suggested in 1889 by Svante Arrhenius and is therefore called an Arrhenius plot. This method uses the logarithm of the rate constant, k, to plot against temperature. Arrhenius plot for the reaction 2HI → H2 + I2 is shown in Figure1. From its slope we can determine activation energy,
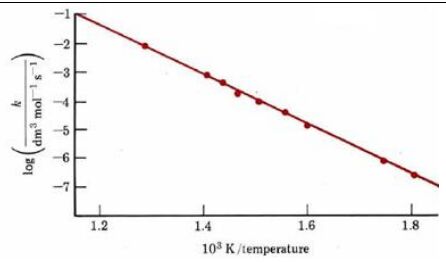
Figure 1:Arrhenius plot for the reaction 2HI → H2 + I2 From the slope of the graph an activation energy  may be calculated.
It should be pointed out that the equations just derived for Arrhenius plots apply
strictly to unimolecular and bimolecular elementary processes. If a reaction mechanism involves several steps, there is no guarantee that the same elementary process will be rate limiting at several widely different temperatures. The observed rate constant may also be a product of several constants, as in the H2 + I2 reaction. If either a different rate-limiting step or the product of constants has a different temperature dependence, then an Arrhenius plot may not be linear. This also makes it dangerous to use such a plot to predict reaction rates at temperatures quite different from the conditions under which experimental measurements were made.
The slope and y-intercept of an Arrhenius plot can be used to determine the
values for the Arrhenius Equation .
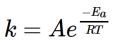
where A is called the frequency factor,  is the activation energy, R is the gas law
constant and T is the temperature in Kelvin. The frequency factor value depends on
how often molecules collide and how orientation of the molecules is related to the
reaction. A benefit of the Arrhenius equation is that it gives a direct method for
computing the dependence of the rate constant, k, on temperature.
1. 依據內文,寫出阿瑞尼士作圖(Arrhenius plot)所依據的反應機構是哪些類型的 基本反應?