阿摩線上測驗
題組內容
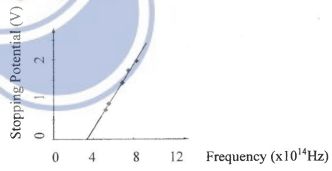
Questions 1.6 - 1.8 refer to the photoclectric
effect and the figure on the right. For an
experiment observation, the stopping potential
was plotted versus the light frequency, as shown
in the figure. The best straight line was fitted to
the experimental points.