所屬科目:研究所、轉學考(插大)◆統計學
1.In hypothesis testing, (A)the smaller the Type I error, the smaller the Type II error will be (B)the smaller the Type I error, the larger the Type II error will be (C)Type II error will not be affected by Type I error (D)the sum of Type I and Type II errors must equal to 1 (E)A test with a 95% confidence level means that there is a 95% chance of getting a type I error.
2.Based on the density diagram, choose a set of hypotheses test regarding the population mean from the following
(A)H₀:μ=15 v.s. Hₐ:μ<15 (B)H₀:μ=15 v.s. Hₐ:μ>15 (C)H₀:μ=0 v.s. Hₐ:μ>0 (D)H₀:μ=0 v.s. Hₐ:μ<0 (E)H₀:μ=0 v.s. Hₐ:μ>15
3.We are interested in conducting a study to determine the percentage of voters of a state would vote for the incumbent governor. What is the minimum sample size needed to estimate the population proportion with a margin of error of .05 or less at 95% confidence? (A)1068 (B)100 (C)770 (D)385 (E)58
4.The following table shows the number of individuals in a sample of 300 who indicated they support the new tax proposal.
We are interested in determining whether or not the opinions of the individuals of the three groups are uniformly distributed. The calculated value for the test statistic equals (A)0 (B)2 (C)4 (D)6 (E)8
5.What is meant by the term "90% confident" when constructing a confidence interval for a mean? (A)If we took repeated samples, approximately 90% of the samples would produce the same confidence interval. (B)If we took repeated samples, approximately 90% of the confidence intervals calculated from those samples would contain the sample mean. (C)If we took repeated samples, approximately 90% of the confidence intervals calculated from those samples would contain the true value of the population mean. (D)If we took repeated samples, the sample mean would equal the population mean in approximately 90% of the samples. (E)We are 90% confident that 90% of the data falls within the confidence interval.
6.The test for goodness of fit. (A)is always an upper tail test. (B)is always a lower tail test. (C)is always a two-tailed test. (D)can be a lower or an upper tail test. (E)compares observed and expected means.
7.The producer of a certain bottling equipment claims that the variance of all their filled bottles is .027 or less. A sample of 30 bottles showed a standard deviation of 10 ounces. The p-value for the test is (A)less than 0.01 (B)between 0.01 and 0.025 (C)between 0.025 and 0.05 (D)between 0.05 and 0.1 (E)larger than 0.1
8.Regression analysis was applied between sales data (y in $1000s) and advertising data (x in $100s) and the following information was obtained.
=12+1.8X, n=17, SSR=225, SSE=75, σ̂b₁=0.2683
The F statistic computed from the above data is (A)3 (B)45 (C)48 (D)50 (E)60.
9.Suppose the number of car accidents per day follows a Poisson distribution with mean 3 in a metropolis. Find the probability that there are at least 2 car accidents in a 2-day period. (A)1-7e⁻⁶ (B)1-7e⁻³ (C)7e⁻⁶ (D)7e⁻³ (E)None of the above
10.I. The difference between the sample mean and the population mean is called the margin of error.
II. The difference between the upper limit of a confidence interval and the point estimate used in constructing the confidence interval is called the margin of error.
III. The margin of error equals to half the width of a confidence interval.
IV. The sampling error can either be positive or negative. Which above statement(s) is (are) correct? (A)I, III (B)I, II, III (C)II, III, IV (D)II, IV (E)I, II, III, IV
11.Shown below is a portion of a computer output for regression analysis relating y (dependent variable) and x (independent variable). Which of the following statements is correct?
(A)The sample size for the above regression analysis is 9. (B)It would be significant if we perform a t test to determine whether or not x and y are related. Let α=.05. (C)Perform an F test to determine whether or not x and y are related would have the same results as a t test at α=.05. (D)The square root of the t statistic is the F statistic. (E)The correlation coefficient of X and Y is 0.49.
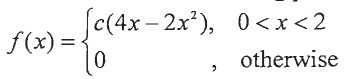
12.Assume X is a continuous random variable with the following pdf:
Find P(X>1)=? (A)1/8 (B)1/4 (C)3/8 (D)1/2 (E)5/8
13.A marketing study was conducted to compare the variation in the age of male and female purchasers of a certain product. Random and independent samples were selected for both male and female purchasers of the product.The sample data is shown here:
Female: n=31, sample mean=50.30, sample standard deviation=13.215
Male: n=21, sample mean=39.80, sample standard deviation=10.040
Calculate the test statistics that should be used to determine if the variation in the female ages exceeds the variation in the male ages. (A)F=0.760 (B)F=1.316 (C)F=1.264 (D)F=0.577 (E)F=1.732
14.Which of the following is a property of the sampling distribution of ? (A)if you increase your sample size, will always get closer to μ, the population mean. (B)the standard deviation of the sample mean is the same as the standard deviation from the original population σ. (C)the mean of the sampling distribution of is μ, the population mean. (D) always has a Normal distribution. (E)If the population is not normal, the Central Limit Theorem is invalid.
15.Which of the following statements about small-sample and large-sample confidence intervals for proportions p are true? I. The large-sample confidence interval formula for proportions is valid if np≥5 and n(1-p)≥5. II. Large-sample confidence intervals always contain the true parameter value, whereas small-sample confidence intervals may not. III. We form small-sample confidence intervals by using the large-sample formula after adding 4 successes and 4 failures. (A)I only (B)II only (C)III only (D)I and III only (E)I, II, and III
16.Which of the following is correct about the residuals vs. fits plot?
(A)the plot suggests non-equal variance (B)the plot suggests a too small sample size (C)the plot suggests a non-parametric analysis is needed (D)the plot suggests a non-linear relationship (E)the plot suggests outlier analysis is needed
17.Suppose you use regression to predict the height of a woman's current boyfriend by using her own height as the explanatory variable. Height was measured in feet from a sample of 100 female undergraduates, and their boyfriends at NCKU university. Now, suppose that the heights of both the women and the men are converted to centimeters. The impact of this conversion on the slope is: (A)the sign of the slope will change. (B)the p-value of the slope should be the same. (C)the magnitude of the slope becomes larger. (D)the coefficient of determination, R square, will decrease. (E)None of the above.
18.Let's build a regression model between mpg (miles per gallon) as outcome and wt (weight) as predictor for mtcars dataset. Which value in the output seems unreasonable?
(A)The coefficient of wt (B)The Multiple R-squared (C)The p-value of wt (D)The minimum value of residuals (E)The std. error of wt
19.In an ANOVA, which of the following is most likely to produce a large value for the F-ratio? (A)small mean differences and large sample variances (B)small mean differences and small sample variances (C)large mean differences and large sample variances (D)large mean differences and small sample variances (E)identical group means and increasing sample sizes
20.An insurance company sets up a statistical test with a null hypothesis that the average time for processing a claim is 7 days, and an alternative hypothesis that the average time for processing a claim is greater than 7 days. After completing the statistical test, it is concluded that the average time exceeds 7 days. However, it is eventually learned that the mean process time is really 7 days. What type of error occurred in the statistical test? (A)random error (B)margin of error (C)Type II error (D)Type I error (E)No error occurred in the statistical sense.
21.Suppose that X is a discrete random variable taking on the values of 0, 1 and 2, and the corresponding probability function f(·) is such that 2f(0)=f(1)=f(2). Then, the expected value of X is (A)1/5 (B)2/5 (C)4/5 (D)1 (E)6/5
22.The following sum of squares are produced.
Σ(yᵢ-ȳ)²=200, Σ(yᵢ-ŷᵢ)²=80, and Σ(ŷᵢ-ȳ)²=120. The percentage of the variation in y that is explained by the variation in x is (A)25% (B)80% (C)33% (D)60% (E)66%
23.Let (Yᵢ, xᵢ), i=1,2,...,n, be a random sample. (A)Since the sample correlation coefficient is found to be r=0.9, simple linear regression model would be suitable for modelling the relationship for Y and x. (B)It is further known that both the sample standard deviations of Y and x are 1's, then the estimated regression coefficient would be 0.9. (C)Normal distribution assumption is a must for the error term if we want to find the least squares estimate. (D)A significant result can be obtained if r=0.9, because the value is large enough. (E)None of the above.
24.Part of an ANOVA table is shown below.
The sample size is (A)4 (B)5 (C)18 (D)22 (E)None of the above.
25.The distribution for X is uniform. What can we say for certain about the distribution for ΣX when sample size n=50? (A)distribution for ΣX is still uniform with the same mean and standard deviation as the distribution for X. (B)distribution for ΣX is still uniform with the larger mean but a smaller standard deviation as the distribution for X. (C)The distribution for ΣX is normal with the same mean but a larger standard deviation as the distribution for X. (D)The distribution for ΣX is normal with a larger mean and a larger standard deviation than the distribution for X. (E)The distribution for ΣX is normal with the same mean but a smaller standard deviation than the distribution for X.
 阿摩線上測驗
登入
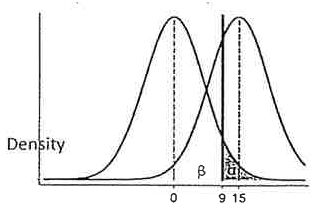 (A)H₀:μ=15 v.s. Hₐ:μ<15 (B)H₀:μ=15 v.s. Hₐ:μ>15 (C)H₀:μ=0 v.s. Hₐ:μ>0 (D)H₀:μ=0 v.s. Hₐ:μ<0 (E)H₀:μ=0 v.s. Hₐ:μ>15

 =12+1.8X, n=17, SSR=225, SSE=75, σ̂b₁=0.2683
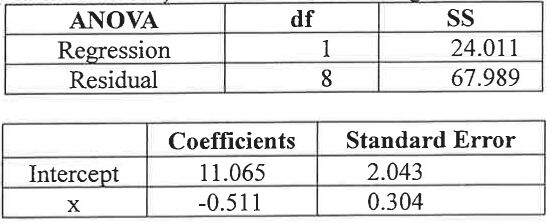 (A)The sample size for the above regression analysis is 9. (B)It would be significant if we perform a t test to determine whether or not x and y are related. Let α=.05. (C)Perform an F test to determine whether or not x and y are related would have the same results as a t test at α=.05. (D)The square root of the t statistic is the F statistic. (E)The correlation coefficient of X and Y is 0.49.
 ? (A)if you increase your sample size,
 will always get closer to μ, the population mean. (B)the standard deviation of the sample mean is the same as the standard deviation from the original population σ. (C)the mean of the sampling distribution of
 is μ, the population mean. (D)
 always has a Normal distribution. (E)If the population is not normal, the Central Limit Theorem is invalid.
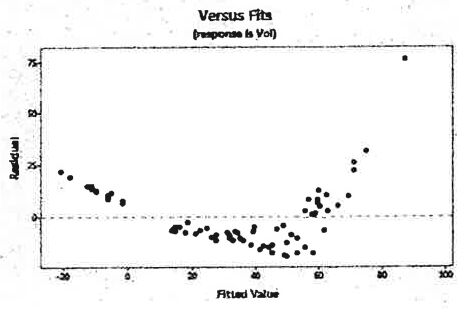 (A)the plot suggests non-equal variance (B)the plot suggests a too small sample size (C)the plot suggests a non-parametric analysis is needed (D)the plot suggests a non-linear relationship (E)the plot suggests outlier analysis is needed
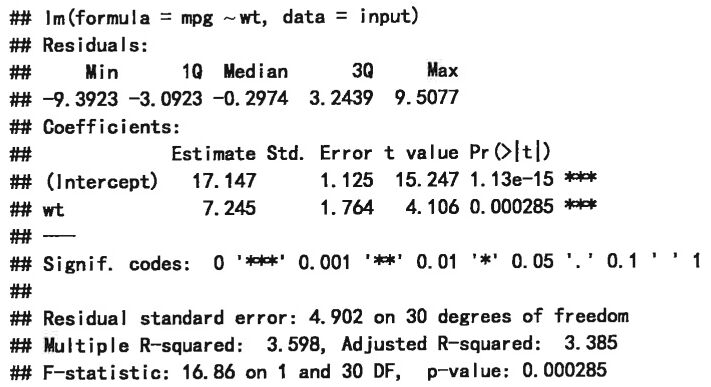 (A)The coefficient of wt (B)The Multiple R-squared (C)The p-value of wt (D)The minimum value of residuals (E)The std. error of wt
