 阿摩線上測驗
89. The figure below shows the absorbance curve at 260 nm of five 100 bp double-stranded DNA fragments (samples A to E) when subjected to heat. DNA denaturation produces a hyperchromic effect. Which sample has the highest G-C content, according to this graph?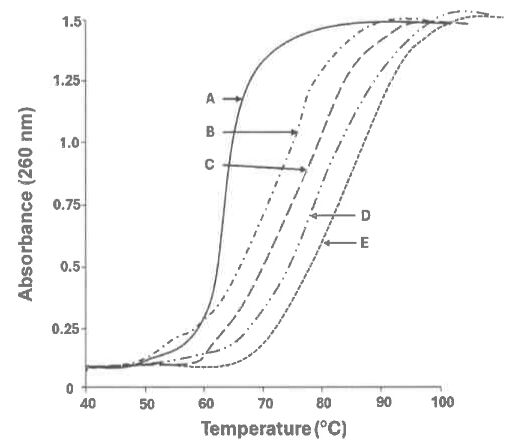
(A) A
(B) B
(C) C
(D) D
(E) E
答案:登入後查看
統計: A(0), B(0), C(0), D(0), E(3) #3853394
統計: A(0), B(0), C(0), D(0), E(3) #3853394