所屬科目:研究所、轉學考(插大)◆統計學
(1). (10%) Please show that the straight line best fits the points is , where
(2). (3%) Given five observed data points in Table 1: Please use the results of (1) to find the least-squares line (regression line).
(3). (5%) Please evaluate the coefficient of determination
(1). (5%) What is the probability distribution of ?
(2). (10%) Let x1 , x2 , x3 , …, xm be m samples of a random variable X . If m is sufficiently large ( m 30 ), please show that the 95% confidence interval for the mean of X is: where and denote the sample mean and sample standard deviation, respectively.
4. (5%) Let and Var ( X ) denote the expectation and variance of a random variable X , respectively. Please show that
(1). (7%) What is the probability density function of , where μ and σ>0 are constant?
(2). (7%) Please show that the correlation coefficient between N(s) and N(t) is , where 0≤ s < t ≤ T .
(3). (12%) Let denote the price of a stock, where S ( 0 )= 10 is the share price at t = 0 . What is the expected share price at t = T ? That is, please evaluate the expectation of S(T) . ( Hint: N(t)=N(t)-N(0) is normally distributed.)
(4). (12%) Let X = . Please show that the expectation of X is You may begin with finding the minimum value of N(1) such that S(1)≥ 10 .
 阿摩線上測驗
登入
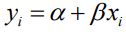 , where
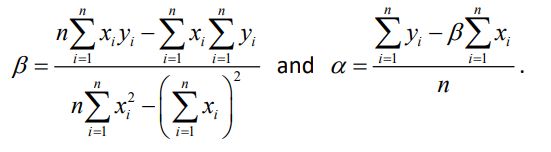
 Please use the results of (1) to find the least-squares line (regression line).
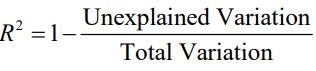
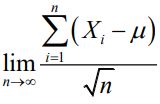 ?
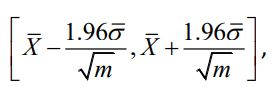
 and
 denote the sample mean and sample standard deviation, respectively.
 and Var ( X ) denote the expectation and variance of a random variable X , respectively. Please show that

 , where μ and σ>0 are constant?
 , where 0≤ s < t ≤ T .
 denote the price of a stock, where S ( 0 )= 10 is the share price at t = 0 . What is the expected share price at t = T ? That is, please evaluate the expectation of S(T) . ( Hint: N(t)=N(t)-N(0) is normally distributed.)
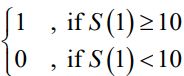 . Please show that the expectation of X is
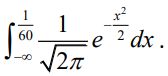 You may begin with finding the minimum value of N(1) such that S(1)≥ 10 .