 阿摩線上測驗
14. The figure shows three graphs of how a potential varies along an x axis. V₁ = -200 V, x₁ = 0.20 m; V2 = 400 V, x2 = 0.40 m; V3 = 300 V, x3 = 0.30 m. Rank the situations according to the magnitude of the electric field along the axis. 
(A) 1=2=3,
(B) 2>3>1,
(C) 3>1>2,
(D) 3>1=2,
(E) 1>2>3.
(A) 1=2=3,
(B) 2>3>1,
(C) 3>1>2,
(D) 3>1=2,
(E) 1>2>3.
答案:登入後查看
統計: A(1), B(0), C(0), D(0), E(0) #3332073
統計: A(1), B(0), C(0), D(0), E(0) #3332073
詳解 (共 2 筆)
助人為本
#7399269
所以這題問電場大小
所以電場會等於-電位/時間
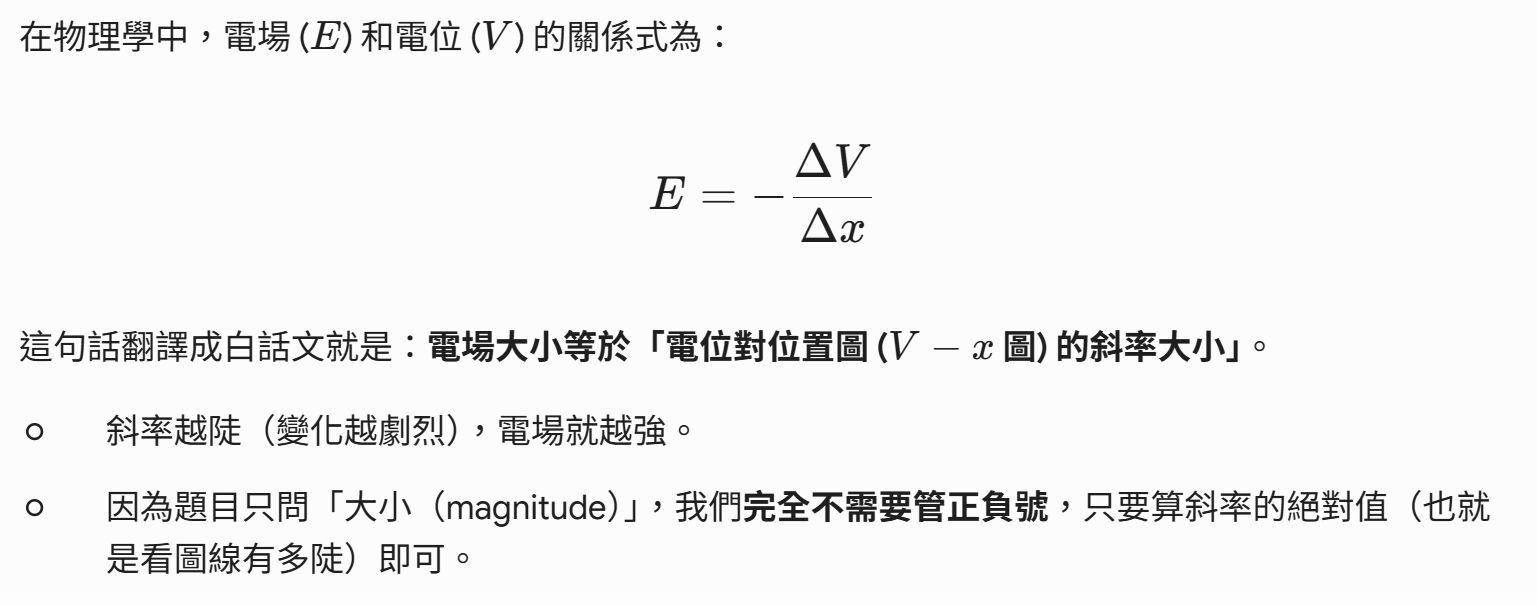
所以算出三者的斜率皆為1000
不用管負號,題目只問大小
0
0